


Abstract
The management of small vessels has always been key to maritime administration. This paper presents a novel method for recognizing small fishing vessels based on laser sensors. Using four types of small fishing vessels as targets, a recognition method for small fishing vessels based on Markov transition field (MTF) time-series images and VGG-16 transfer learning is proposed. In contrast to conventional methods, this study uses polynomial fitting to obtain the contours of a fishing vessel and transforms one-dimensional vessel contours into two-dimensional time-series images using the MTF coding method. The VGG-16 model is used for the recognition process, and migration learning is applied to improve the results. The UCR time-series public dataset is used as a transfer learning dataset for the MTF time-series image encoding. The experiment demonstrates that the proposed method exhibits higher accuracy and performance than 1D-CNN and other general neural network models, and the highest accuracy rate is 98.92%.
Introduction
The automatic detection of vessel targets can improve the monitoring of vessels in rivers and seas through manpower, which can reduce the workload and management costs. Using a vessel identification system, illegal vessels can be effectively detected, and illegal acts can be recognized through the type and identification of the vessels. In the field of fishing vessels and commercial vessel management, vessel target detection is helpful for improving the level of sea area management and conserving marine resources1. Furthermore, in the military field, vessel target detection can aid in defense against enemies or can be used to gain an advantage in battles.
Small ships generally have a displacement of 50 tons or less, and are the main fishing vessels in offshore and inland rivers worldwide. With the rapid development of shipping and fisheries, waterway and fishing ground management are facing significant challenges. The management and monitoring of small fishing vessels require urgent informationization and automation. To date, the main techniques of vessel target detection systems have been based on radar scanning, automatic identification systems (AISs), or optical imaging, each of which exhibits several deficiencies.
The radar system can actively detect vessels by sending electromagnetic waves; it has all-weather and all-day detection capabilities. However, small vessels always have smaller reflection cross-sections and lower ship heights, and thus, small vessels are usually undetectable by conventional radar. The AIS is an automatic tracking system that uses transceivers on ships. It provides ship information such as the identification, position, course, and speed. The system requires ships to share information. This does not apply to noncooperative targets2. Optical imaging systems mainly contain visible-light CCTV and infrared systems. Owing to reflections in water or frequent rain and fog scenes, the collected images frequently exhibit interference. Therefore, this study proposes a method based on an infrared laser sensor to classify and identify hull contour structures from different vessels. This offers an effective method based on a different data model, which aids in improving the robustness of the entire vessel detection system.
Laser sensors have been used extensively in obstacle detection and recognition, environment reconstruction, and the recognition of unmanned vehicles or ground mobile robots3. With the increasing research on and improvement of deep neural network algorithms, applications can reach a state-of-the-art level based on laser data4,5. Therefore, this study attempts to use a deep learning model to recognize small vessels based on a laser sensor. As illustrated in Fig.? 1, different ships always have different sizes, shapes, and materials. All of these cause the laser point of the sequence to have different shapes and distributions. The method of encoding contour data can further expand the features of these contour data dimensionally, which is more conducive to the comprehensive capture of features by the deep learning network model and improve the identification performance of small fishing boats. Therefore, this study proposes a recognition method for small fishing vessels based on the Markov transition field (MTF) timing diagram and VGG-16 transfer learning.
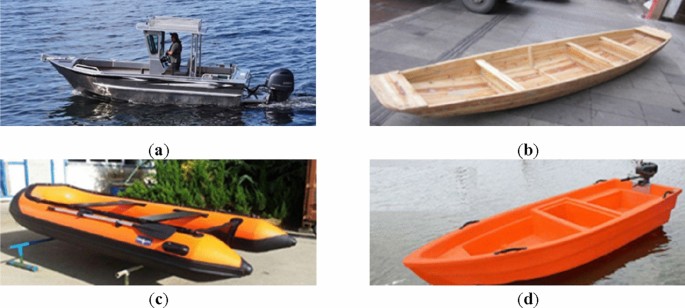
Types of four different types of small fishing vessels. (a) Small alloy fishing vessels, (b) wooden fishing vessels, (c) rubber inflatable fishing vessels, (d) PE plastic fishing vessels.
In this study, paper proposes a new efficient method to recognize small vessels based on one dimensional signal of laser sensors. This is an additional method of multi model data application in small vessels recognition area. Meanwhile considering that the sample data is small, we train the model by using transfer learning based on the UCR time series public dataset. The one-dimensional laser signal is transformed into MTF images to expand the scale and dimension of signals. Then the different type of vessels will be easier to distinguish6. So, another contribution of this paper is that a modification block is proposed based on VGG-16 for improving the classification of MTF images.
Related work on vessel recognition can be divided into two main directions: conventional machine learning methods to realize vessel recognition and vessel recognition based on deep learning methods. Xia et al.7 proposed a vessel target detection algorithm based on a multifeature and variance-feature dynamic fusion model for optical remote sensing images. The vessel target was trained and predicted using a support vector machine based on the geometrical features. Damastuti et al.8 tested a real-time AIS database using KNN and neighborhood component analysis. The experiments classified ships in Indonesian waters based on the tonnage, length, and width. With the aim of the reliable and timely recognition of vessel targets in maritime battlefields, Guo et al.9 proposed a vessel recognition and distinguishing method based on the entropy of optical remote sensing data. According to the entropy, a decision tree based on hierarchical discriminant regression was constructed to identify different vessels in the data from an optical remote sensing system.
In contrast to simple machine learning research methods, several researchers have combined conventional algorithms with machine learning algorithms to enhance the advantages and improve the target recognition performance. Han et al.10 proposed a hierarchical process target recognition method based on evidence fractal analysis to solve the problem of incomplete images. Zhu11 and others presented a vessel detection method based on the shape and texture features for vessel optical image recognition. A new semi-supervised hierarchical classification method was used to distinguish vessels from non-vessels and the majority of false positives were eliminated. Khan12 proposed a vessel recognition method based on a directional gradient histogram and bag-of-words for infrared vessel images, and experimentally demonstrated the advantages thereof over other algorithms. Moreover, various researchers have used different algorithms to construct good vessel recognition models and have achieved good results. Zhang et al.13 introduced a vessel recognition method based on Bayesian reasoning and evidence theory and verified the proposed method in simulated combat scenes. The results indicated that, compared to other vessel recognition methods, the proposed method achieved performance advantages in terms of the recognition accuracy. Wang et al.14 proposed a support vector regression recognition method based on an improved particle swarm optimization algorithm to solve the problem of inaccurate models. In addition to machine learning technology, deep learning has rapidly developed, and many deep learning methods have been applied to vessel images to realize target recognition. Liu et al.15 developed an enhanced convolutional neural network (CNN) to improve vessel detection under different weather conditions. Chen et al.16 proposed a new vessel-type recognition framework based on deep learning, known as coarse-to-fine cascade CNN, and the model performance was proven experimentally. Huang et al.17 proposed a vessel detection method based on deep learning to solve the problem of detecting vessels of different sizes and types under complex sea conditions and improved the convolutional network. With the improvement in the resolution of synthetic aperture radar (SAR) images, Dong et al.18 presented a vessel classification framework based on a depth residual network for high-resolution SAR images. Lang et al.19 proposed an infrared intrusion target detection and classification method based on a neural network according to the characteristics of infrared target vessels and the detection difficulty. Ma et al.20 proposed a new concept that involves an improved YOLO v3 and KCF algorithm to obtain accurate recognition and authenticity detection of water targets.
Deep learning methods usually exhibit better accuracy and efficiency but often require large amounts of labeled data and high computational costs. In view of the problems of an insufficient labeled dataset, an unoptimized polarization image, and noise interference in vessel classification. Jeon et al.21 proposed a method that combined CNN and KNN models to improve the classification efficiency of vessels. To overcome the small number of datasets, Mishra et al.22 conducted a study on the transfer learning method in CNNs and tested it on the AlexNet, VGGNet, and ResNet architectures for ship classification tasks on MARVEL datasets. Li et al.23 presented a vessel recognition method based on a ResNet neural network and migration learning.
This study focuses on a laser sensor that outputs the one-dimensional contour data of vessels for the classification and identification of small fishing vessels. The fitting results of a one-dimensional contour are encoded into two-dimensional time-series images to enlarge the feature differences in terms of the scales and dimensions. Transfer learning is introduced into the model to achieve better accuracy and a lower computational cost. In ?EURoeMaterials and methods?EUR?, the image recognition method for small fishing vessels is described in detail. ?EURoeExperiment?EUR? presents the analysis of specific related experiments, including the settings of the experimental equipment environment, preparation of datasets, and analysis of the experimental results. ?EURoeConclusion?EUR? concludes the paper.
Materials and methods
The contour data of different small fishing vessels are sampled using on the SICK laser contour sensor, following which the contour data are encoded into time-series images based on the Markov migration field24. The output images are input into the VGG neural network model for pretraining. Finally, pretrained parameter migration learning is applied to enhance the recognition effect of the neural network model. This study was conducted in three steps. The contour data of different fishing vessels were obtained using the SICK laser contour scanning equipment. The contour data were used as one-dimensional time series, which were encoded into two-dimensional time-series images. The classification and recognition of small fishing vessels were realized by VGG-16 neural network model migration learning, and the advanced nature of this method was verified experimentally. The flowchart of this study is shown in Fig.? 2.
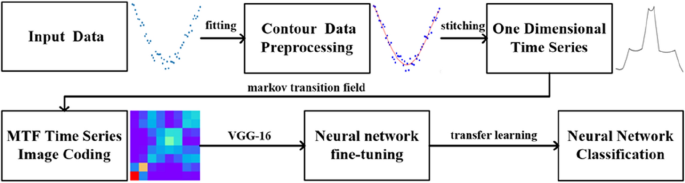
Flow chart of our method.
Contour data fitting
As the contour data of fishing vessels are circling data from 0?? to 360??, the contour data of fishing vessels from 0?? to 360?? are spliced into one-dimensional contour data according to the circling direction to retain the data characteristics of different fishing vessels to the greatest extent. The contour data are input as a one-dimensional time series of the Markov migration field. The profile data pattern of the fishing vessels sampled using laser sensing equipment is depicted in Fig.? 3 (using a PE plastic fishing vessel as an example).
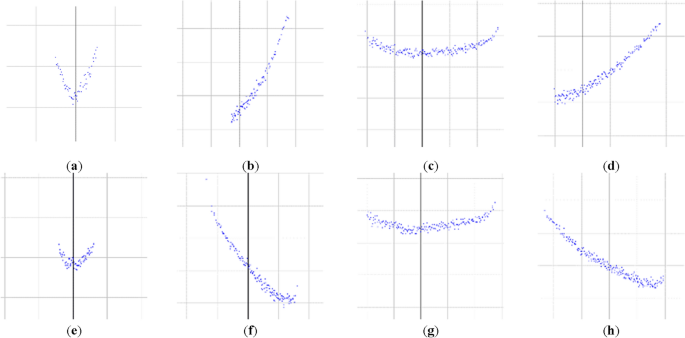
The scan results by LIDAR with different angle. (a) 0??, (b) 30??, (c) 90??, (d) 120??, (e) 180??, (f) 240??, (g) 270?? scan result, (h) 300??.
As the original vessel contour data are scattered, substantial invalid information exists; thus, it is necessary to fit and clean the data. Prior to fitting, to ensure the accuracy of the fitting results, the single scattered points far from the contour are eliminated. The cleaned vessel contour data are fitted using a polynomial curve fitting algorithm25, and the specific fitting process is described in detail below.
A polynomial curve fitting method is adopted for the fitting of scatter data approaching the curve. For a set of data, the fitting polynomial of (A=leftt_2in u_i,t_nin u_j \ vdots ddots vdots \ m_mathitij,kin mathrmN^*):
The sum of squares of errors is expressed as:
To obtain the qualified value, the partial derivative of the equation is obtained, and matrix (3) is obtained following simplification using the Vandermond matrix:
Equation? (3) can be abbreviated as Eq.? (4):
Equation? (3) can be abbreviated as Eq.? (4): where (V,) (C,mathrm and) (U) correspond to the three matrices in Eq.? (3) and the coefficient matrix is the required fitting curve result. After fitting the original contour data using the fitting algorithm, all of the fitting results are obtained, as indicated in Fig.? 4.
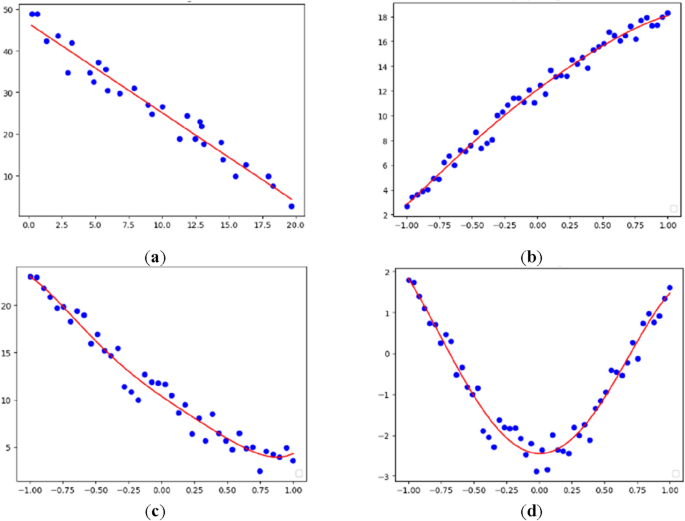
Parts of four types small fishing vessels data. (a) Small alloy fishing vessels, (b) wooden fishing vessels, (c) rubber inflatable fishing vessels, (d) PE plastic fishing vessels.
Contour data splicing
After fitting all data of the fishing vessel contour, the fitting results must be spliced to generate the one-dimensional time series that are required in the following method. The fitting results are stitched according to the sequence of actual fishing vessel contours. In the splicing process, the intersection points of the fitting result function equations are used as the connection point, and the fitting results of each part are spliced into the final results of the continuous fitting26. The specific connection effect is illustrated in Fig.? 5.
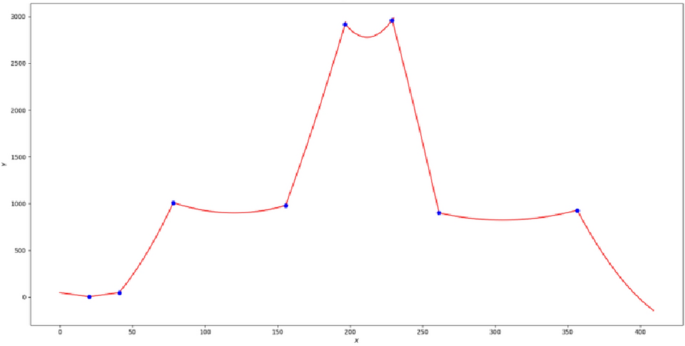
A renderings of all fitting results with the intersection point of fitting function equations as the splicing point.
Following the splicing of the final fitting results, the data near the intersection point can be cleaned so that every value on the X-axis has a unique correspondence with a value on the Y-axis. In this manner, the final fitting result can be approximately treated as a special one-dimensional signal; that is, the fitting result can be regarded as one-dimensional time-series data for the input in the following method27.
Contour data splicing
In the transition process of certain factors of a system, the n-th result is only affected by the n-1 result; that is, it is only related to the state in the previous moment and is unrelated to the past state. The concept of state transition is introduced into the Markov analysis. Markov state transition refers to the transition of objective objects from one state to another. The Markov transfer matrix is insensitive to the time dependence of the sequence; therefore, the MTF is introduced based on a first-order Markov chain and considering the time position relationship28. The specific connection effect is depicted in Fig.? 5.
Post Disclaimer
The information provided in our posts or blogs are for educational and informative purposes only. We do not guarantee the accuracy, completeness or suitability of the information. We do not provide financial or investment advice. Readers should always seek professional advice before making any financial or investment decisions based on the information provided in our content. We will not be held responsible for any losses, damages or consequences that may arise from relying on the information provided in our content.
