


Abstract
Limited data significantly hinders our capability of biothreat assessment of novel bacterial strains. Integration of data from additional sources that can provide context about the strain can address this challenge. Datasets from different sources, however, are generated with a specific objective and which makes integration challenging. Here, we developed a deep learning-based approach called the neural network embedding model (NNEM) that integrates data from conventional assays designed to classify species with new assays that interrogate hallmarks of pathogenicity for biothreat assessment. We used a dataset of metabolic characteristics from a de-identified set of known bacterial strains that the Special Bacteriology Reference Laboratory (SBRL) of the Centers for Disease Control and Prevention (CDC) has curated for use in species identification. The NNEM transformed results from SBRL assays into vectors to supplement unrelated pathogenicity assays from de-identified microbes. The enrichment resulted in a significant improvement in accuracy of 9% for biothreat. Importantly, the dataset used in our analysis is large, but noisy. Therefore, the performance of our system is expected to improve as additional types of pathogenicity assays are developed and deployed. The proposed NNEM strategy thus provides a generalizable framework for enrichment of datasets with previously collected assays indicative of species.
Introduction
Pathogens can exhibit a diverse set of properties, such as antibiotic resistance, host cell adherence or host cell cytotoxicity. For example, a pathogenic strain might be toxic but not antibiotic resistant, or vice versa. Integrating data from multiple sources, each of which examines different properties, allows each dataset to provide information another source lacks1. Consequently, models aiming to predict pathogenic potential can be made more effective by integrating results from more than one phenotypic assay2,3. For these efforts, data integration is not trivial and the challenge is further compounded when researchers want to include data generated in prior experiments to enhance the analysis of current observations4,5,6. The prior datasets are often collected with a specific objective in mind (e.g., measure substrate utilization of a bacterium) and so often must be renormalized or harmonized to enable integration and downstream analysis with data from other experiments.
Integration of data from the Centers for Disease Control and Prevention (CDC) Special Bacteriology Reference Laboratory (SBRL) into new assays provides an excellent example of this dataset integration challenge. The SBRL dataset has been under construction since the 1950s and contains curated results of more than 30 biochemical assay data from 28,000 bacterial strains that cover approximately 500 species. Prior to the ubiquity of WGS, these assays were the standard method used to identify bacterial strains. The assays include tests to determine substrate utilization and catalytic activities. Given its size and assay diversity, we hypothesized that this dataset which encoded aspects of a strain?EUR(TM)s identity could provide extra context for a model trained on hallmarks of pathogenicity to assess the threat posed by the bacteria. Here, context refers to the biochemical assays that were used to identify the strain. We recognize that there are newer, more precise techniques for species identification, such as sequencing or mass spectrometry analysis. Our goal here, however, was to take a large, curated prior dataset that was simple to parse but very noisy to see if the additional context about a strain would be useful before undertaking more complex tasks of sequencing or mass spectrometry. The CDC SBRL datasets associated the test results with a unique identifier for each strain, and the only information available for integration of the assays was the species of the bacteria. Therefore, to integrate this dataset with bacterial strains from our new experimental data that measured hallmarks of pathogenicity is non-trivial as the new experimental data represents a different set of tests as well as a different set of strains, with no common strain IDs. We therefore had to find a way to summarize the CDC SBRL data in a manner that would be useful to our machine learning algorithms trained with the pathogenicity assays.
Our work presents a solution to integrate data from prior host toxicity, antimicrobial resistance (AMR), immune reporter, and host adherence assays (henceforth referred to as pathogenicity assays) with CDC?EUR(TM)s SBRL data to determine bacterial pathogenicity. This integration enhanced predictions made by machine learning models trained only with pathogenicity assay data (Fig.? 1A). We used a deep learning approach to embed CDC?EUR(TM)s SBRL data (Fig.? 1B) into a vector space. The vectors were thought of as a new representation for the identification of a strain using data from biochemical assays suitable for machine learning. We then designed an integration technique with data collected from new assays to provide a significant improvement to prediction of pathogenic potential of bacteria with models trained with the pathogenicity assays. We trained a set of machine learning (ML) models for each pathogenicity assay and then combined predictions across assays for a final pathogenicity call (Fig.? 1D). We hypothesized that additional context from bacterial species provided by the CDC SBRL dataset would enhance the ML models, but there was no easy way to integrate the data with the pathogenicity assays directly. To address this issue, we developed two methods to integrate the two datasets.
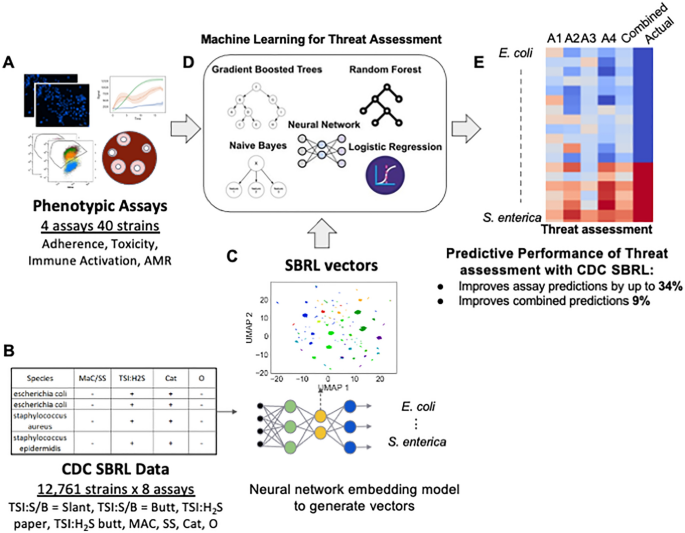
SBRL dataset of phenotypic assays for various strains cannot be easily integrated with other data. (A) Data for hallmarks of pathogenicity. (B) The CDC SBRL dataset contains additional phenotypic assays that focus on identifying bacterial strains. (C) A neural network embedding model to generate bacterial vectors at the species level so the vectors can be integrated with the pathogenicity assays. (D) Each assay integrated with the SBRL vectors are input to ML models to make predictions on bacterial pathogenicity. (E) Evaluation of pathogenic of each bacterial strain from each assay and from combining assays. Red represents a pathogen and blue represents a non-pathogen. A1?EUR”A4: predictions from each assay. Combined: statistical ensemble of A1?EUR”A4. Actual: the actual label.
The first method computed a percent positive signal (pps) per species in the CDC SBRL data and the second method used a deep learning model referred to as a neural network embedding model (NNEM). The NNEM generated mathematical vectors representing bacteria across species from the CDC SBRL dataset (Fig.? 1C) that could be integrated with data from the pathogenicity assays. The vectors were then integrated with the pathogenicity assays to be used as input into the ML models (Fig.? 1D) to assess bacterial pathogenic potential (Fig.? 1E). The vectors serve as a ?EURoeprior?EUR? for the ML models to provide additional context to the data from the pathogenicity assays. By including the SBRL data, we observed an improvement up to 34% in the accuracy for the immune activation assay and a 9% improvement in the overall accuracy when all the assay predictions were combined. Performance improvement was assessed by comparing these results to a set of models that were only trained with pathogenicity assays.
The strategy to integrate heterogeneous data presented here has broader impacts in three aspects. First, the generated vectors can be integrated with other pathogenicity assays as long as the species names are available. Second, although our goal was to predict pathogenicity, the same methods can be applied to other tasks such as phenotypes to characterize bacterial metabolism or enzymatic activity. For example, researchers may be interested in bacterial vectors associated with metabolism rather than vectors associated with pathogenicity. Third, this strategy has the potential to be used in other fields of life sciences where terminology or resolution of terminology are updated over time like immune cell subsets.
Results and discussion
A vector representation of the SBRL assays that preserves species discrimination
The CDC SBRL dataset contains more than 30 different assays that include tests to determine substrate utilization and catalytic activities. Prior to the advent of DNA sequencing, these phenotypic assays were the only method available for bacterial species identification among bacteria that had similar gram staining and colony morphology. The dataset was narrowed down to focus on eight assays that had measurements listed in them for at least 80% of the strains (Table 1).
To determine if these eight assays can differentiate between various types of bacteria, a Uniform Manifold Approximation and Projection (UMAP) dimension reduction was performed to visualize the dataset (Fig.? 2A). Every point in the plot was a bacterial strain. The clusters that were formed based on the results from the selected eight assays belonged to bacteria with the same species names, suggesting the machine-learning approach to use the SBRL results to aggregate similar bacteria together can recapitulate the observations of human microbiologists that were made over the course of decades. The subset of assays that the computer scientists used maintained discriminative power across species.
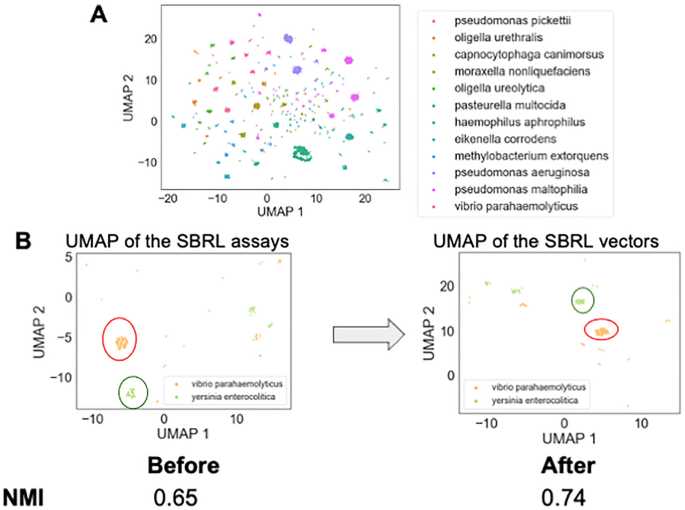
Exploratory data analysis discovered that the SBRL dataset discriminate between different bacterial species. (A) 2D UMAP was performed on the SBRL assays followed by k-means clustering to provide the bacterial samples cluster labels. Every point in the plot is a bacterial sample. The points form groups in the UMAP, suggesting that the SBRL assays can aggregate similar bacteria together. The colors in the figure are the k-mean labels. (B) The neural network model pushes the samples from the same bacteria species closer together. An example output of two species, Vibrio parahaemolyticus and Yersinia enterocolitica, are shown in the UMAP before and after training to show clusters are refined by the model. We quantified how well the samples from the same species are clustered together before and after the training and found the normalized mutual information went from 0.65 to 0.74.
The next challenge was to develop a vector representation for the assays that would be useful to downstream machine learning models. Two solutions were investigated to address this limitation, both of which integrated the data based on species identification. The first method computed the percent of species that have a positive signal from the assay, henceforth referred to as pps (percent positive signal). PPS was considered as a positive control, as it enhanced the pathogenicity assays with the SBRL dataset but did so without the use of machine learning. The second method used a neural network embedding model (NNEM) to create bacterial species vectors using the data from the biochemical assays, henceforth referred to as vectorization. Given we only used data from eight assays and wanted to remain comparable to the PPS, we did not choose to change the dimensionality from eight. The model simply transformed the representation of the eight assays into an eight dimensional vector per species. This process involved as input the various bacterial strains and their biochemical characteristics into NNEM, then asking the model to predict the species name for each strain based on the assay. As Fig.? 2A showed, this should be possible by the model. The architecture of the neural network model is shown in Supplementary Fig. 3. As the model was trained to predict the species name for each strain, it created distinct vectors for each species and these new distinct vectors represented the species for downstream analyses. This learned vector representation of the SBRL biochemical assays was then integrated into our pathogenic models at the species level. In a sense, this approach combined very old data with very new algorithms to enhance the predictive power of machine learning models trained to predict pathogenic potential. We observed that after the NNEM training, the Vibrio parahaemolyticus strains and Yersinia enterocolitica strains from the initial panel of 40 formed tighter clusters (Fig.? 2B). We quantified how much the NNEM helped the strains that belong to the same species cluster together and found an improvement in the normalized mutual information The information provided in our posts or blogs are for educational and informative purposes only. We do not guarantee the accuracy, completeness or suitability of the information. We do not provide financial or investment advice. Readers should always seek professional advice before making any financial or investment decisions based on the information provided in our content. We will not be held responsible for any losses, damages or consequences that may arise from relying on the information provided in our content.Post Disclaimer
